2023
DonorGraphics
Your source for INSIGHTS on communication strategies and giving trends


12th Anniversary Edition
The Giving Sciences team at TrueSense presents insights from 12 years of tracking media and communication trends, charitable behaviors and preferences, and expansion opportunities.
the Giving Trends
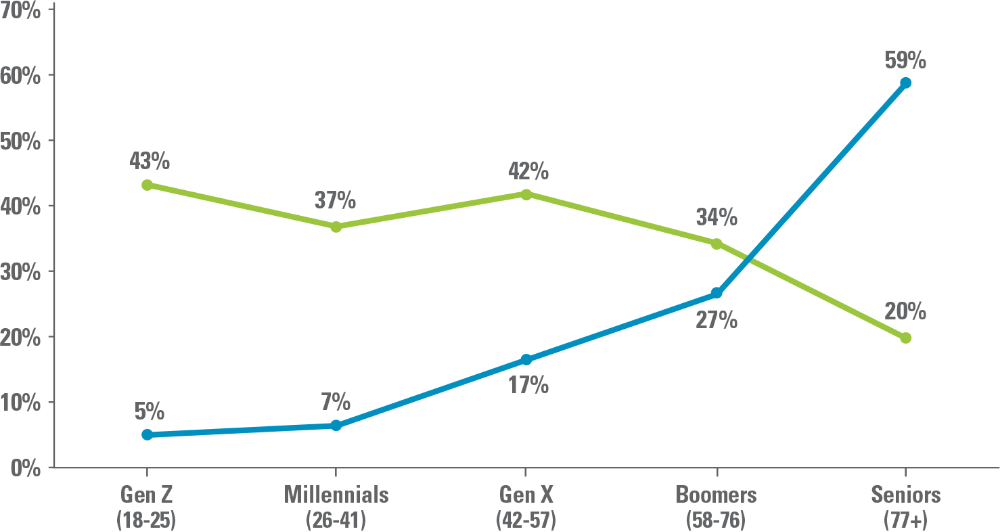
The Giving Shift
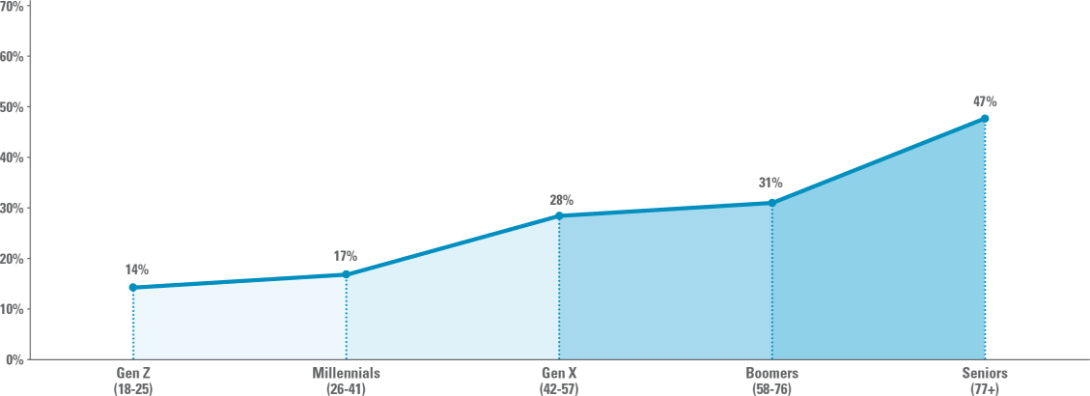
Historically, there was a positive correlation to age and giving charitably, as seen in the 2012 green line. While the overall proportion of givers is very consistent over the past dozen years, at 56% +/- 2 p.p., there has been a democratization of giving. Fewer older donors and more younger donors are participating, leveling the field.
Proportion of Generations Giving Charitably
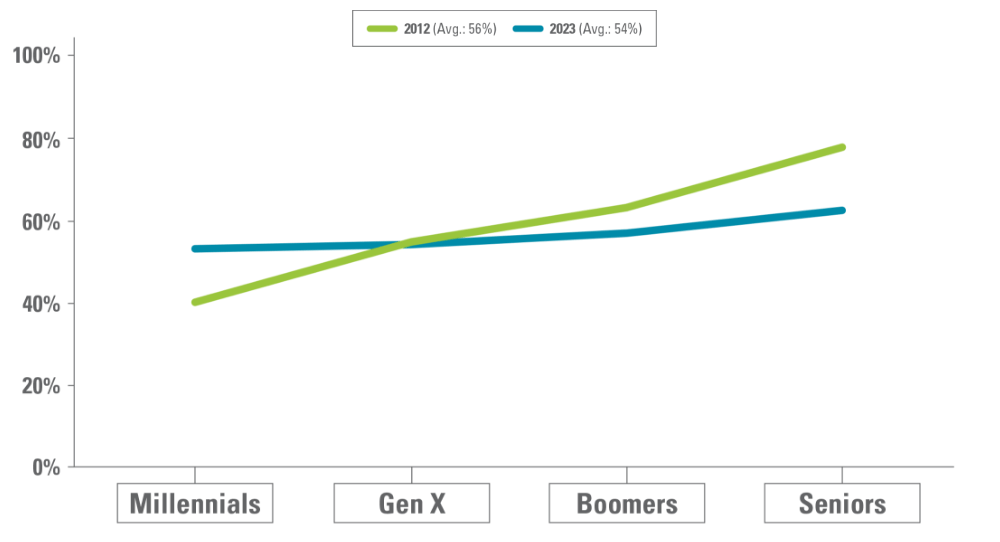
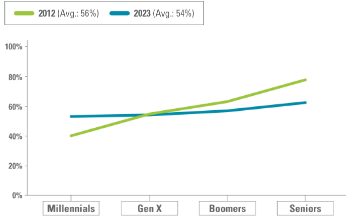
Base: U.S. adults, N=2,229 in 2023; N=3,509 in 2012.
Charitable Giving and Volunteering Rates by Generation
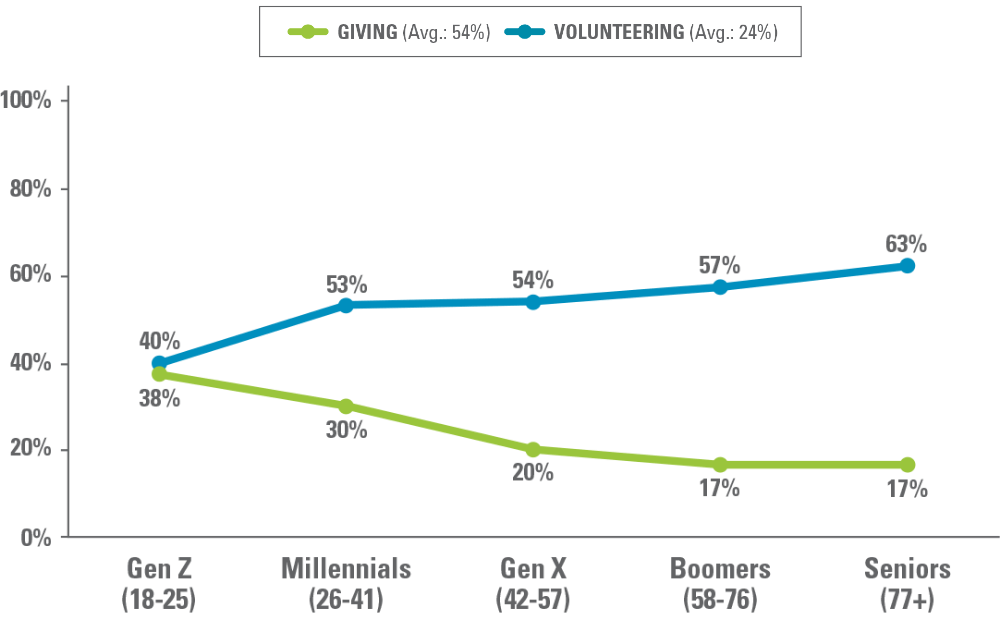
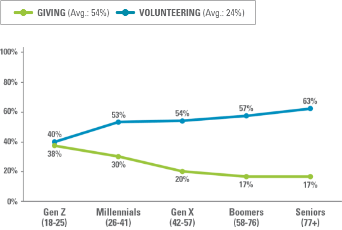
Giving Time or Money
While giving has normalized for Millennials and older, volunteering continues to skew younger. This was further compounded during the pandemic, when older generations' participation dropped even more.
Base: U.S. adults, N=2,229. Giving and volunteering exclude churches/houses of worship and political campaigns.
Spreading the Wealth
Age:
Younger donors give to more organizations and tend to be micro-givers, supporting more organizations at lower levels through social commerce, social fundraising, rounding up, Red Kettles, etc.
In the past two years, Seniors upped their giving to a median of four organizations. But while they report giving more to charity, their average giving per organization is lower. This is reflected in human services giving analyses.
Income:
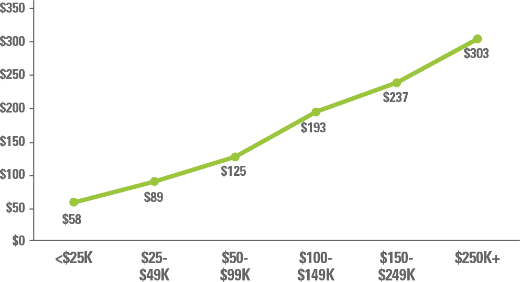
Donors in the higher earning households over $250K (representing just 7% of U.S. households) give to four organizations, and with higher amounts.
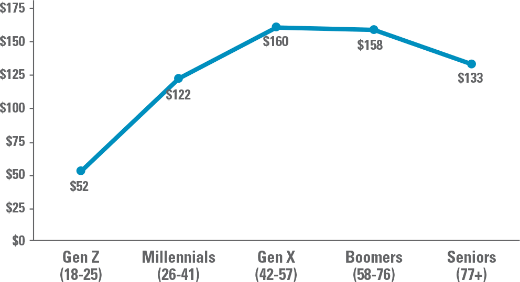
Charitable Giving and Volunteering Average Annual Giving Per Organization (Under $10K)
By Generation
By Household Income
Base: U.S. charitable donors, n=1,196. Self-reported monetary donations exclude donors giving $10K+ (2.3% of all donors).

Charitable donors currently give to a median of just three organizations. Market and donor research can uncover the aspects of your program that current and potential supporters are most passionate about supporting.
Channels of Influence
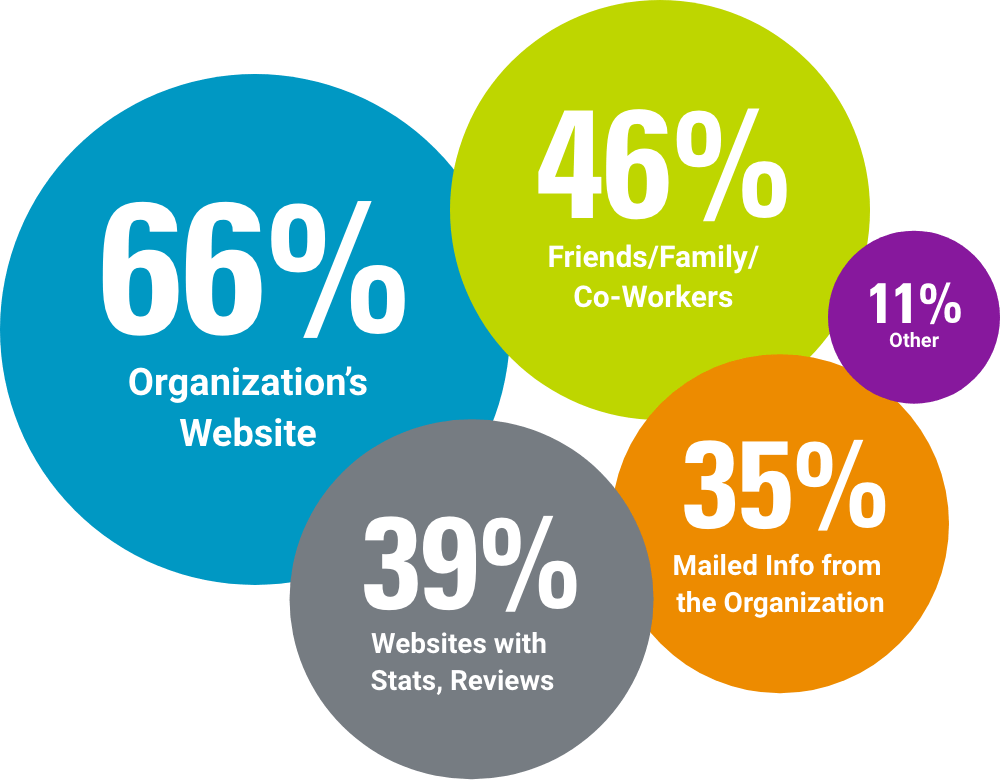
Sources Used to Research before First Gift
More potential donors check out your website than any other source of research. A clean and compelling user experience on your website is foundational to your program.
Base: U.S. Donors n = 1,196. Respondents could choose more than one category or “none of these” (8%).
Base: U.S. Donors n = 1,196. Respondents could choose more than one category or “none of these” (8%).
Most Effective Channel for Encouraging Donations
When donors are asked which of the following is most effective in encouraging a donation, postal mail and email are tied for first, followed by social media. The ranking of channels is identical to last year.
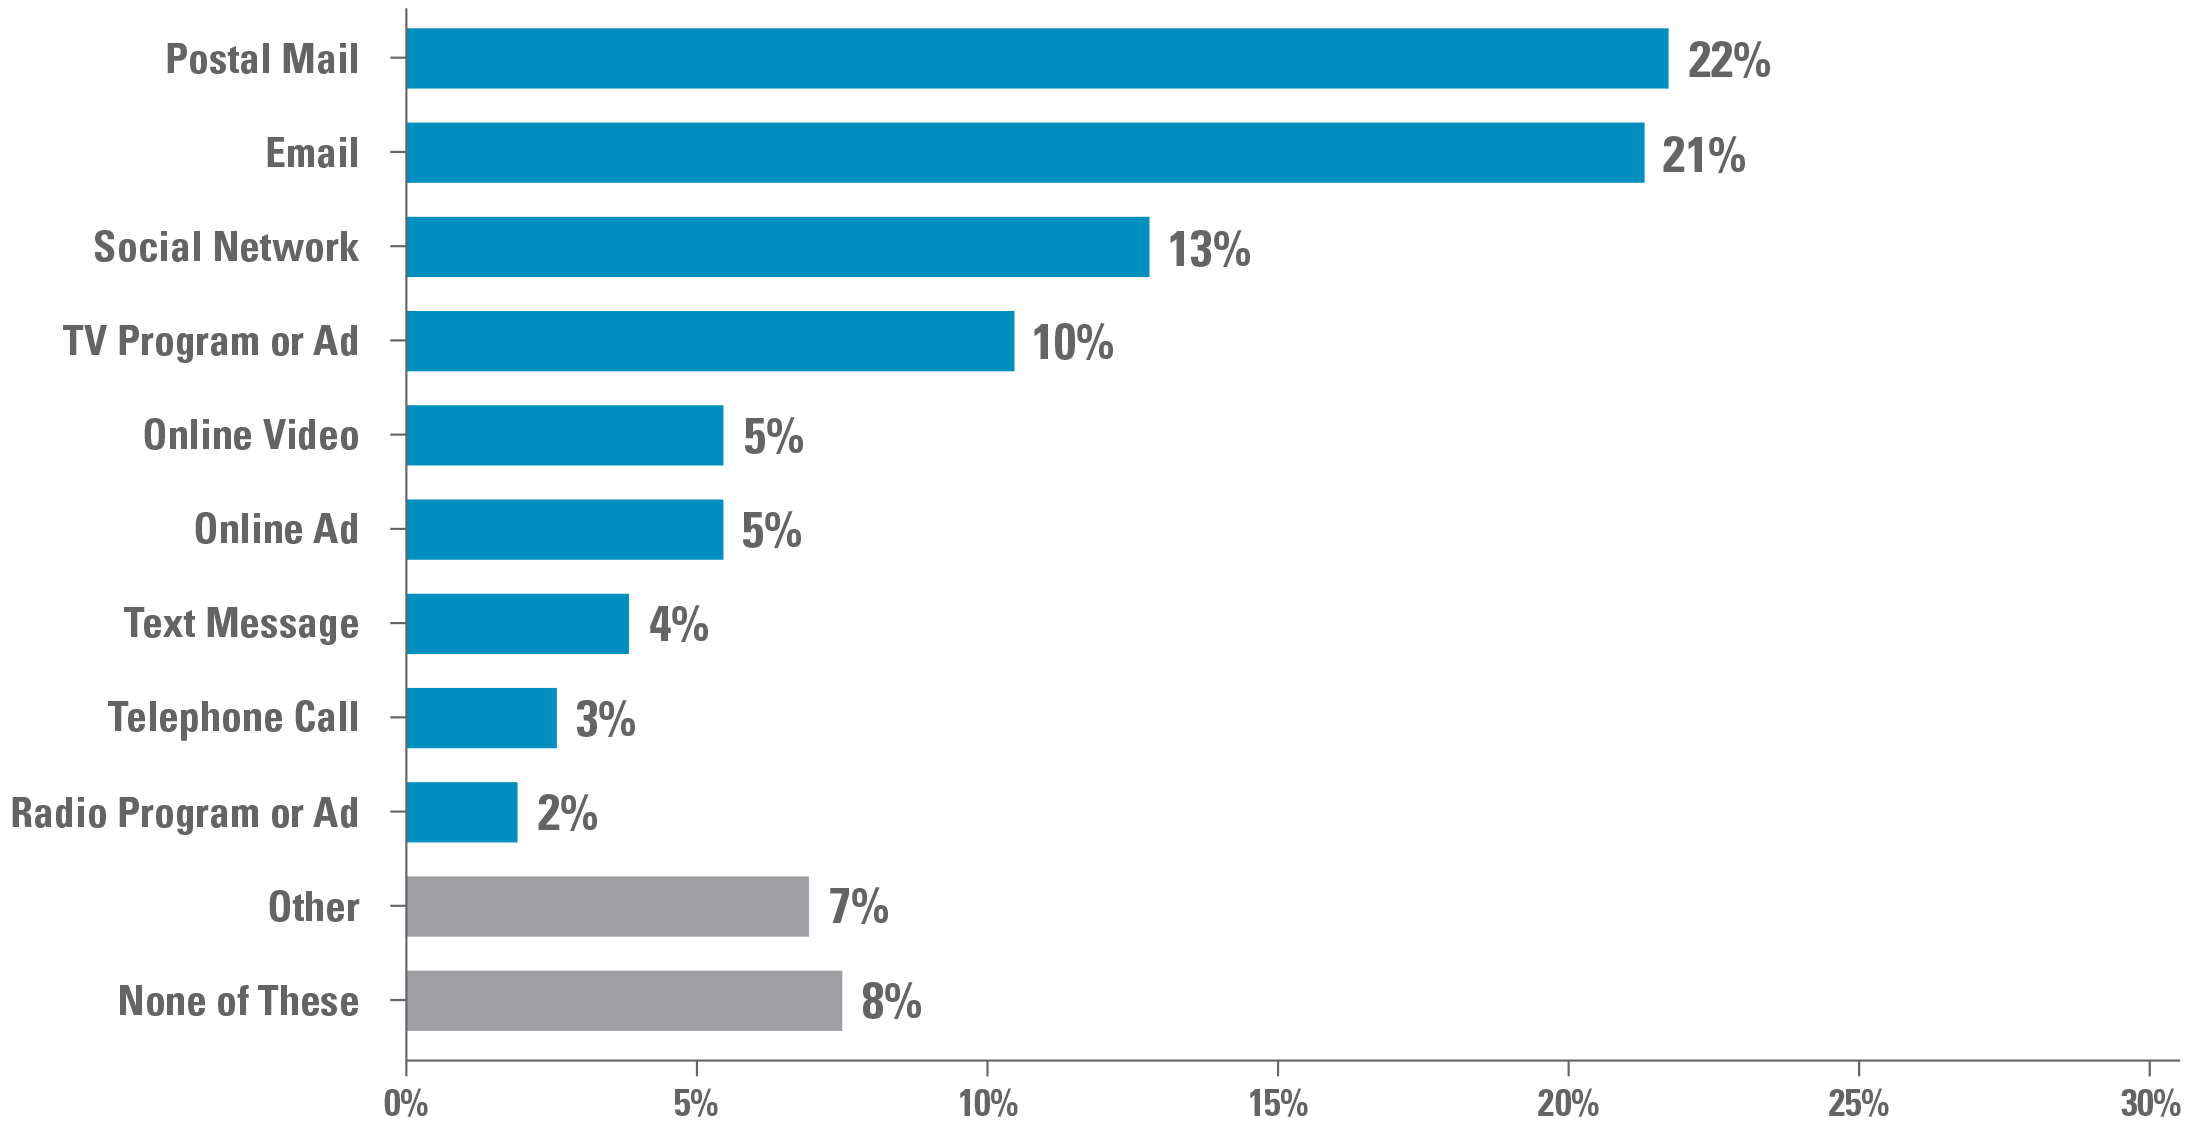
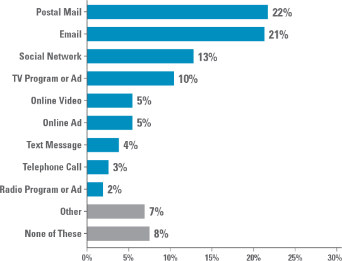
Base: U.S. charitable donors, n=1,196.
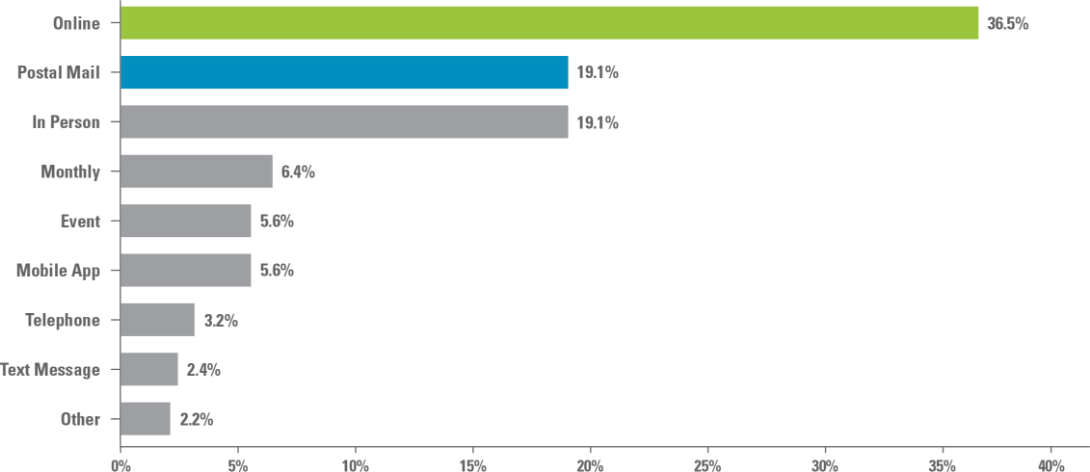
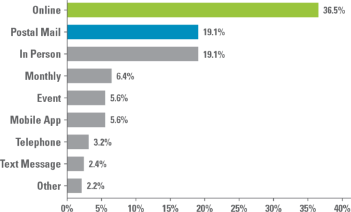
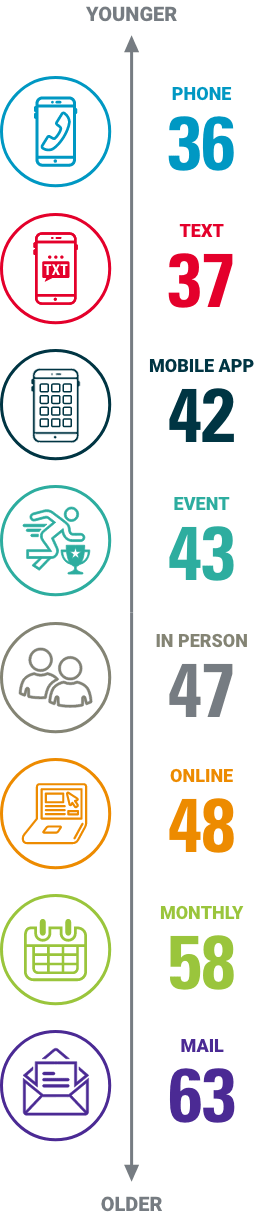
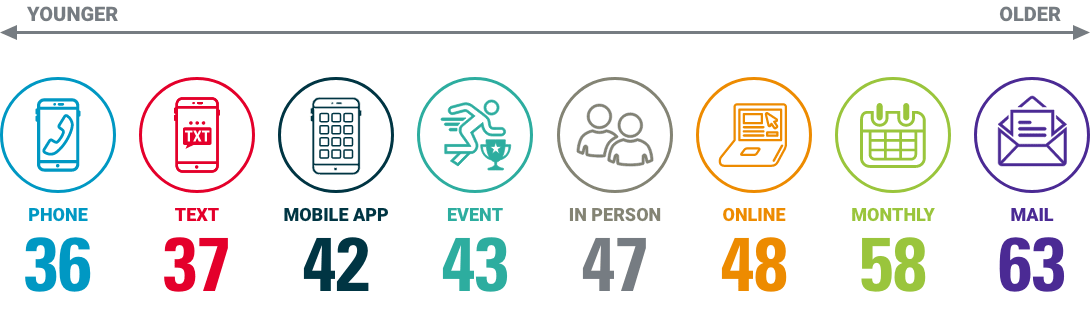
Preferred Channels of Giving
The intersection of online and offline giving preferences continues to move to the right, as older generations are more comfortable transacting online.
The overall distribution is nearly identical to last year, with “In Person” gaining some ground to tie with postal mail.
The differences in preferred channel (or method, in the case of monthly giving) of donation by age can be seen using averages.
Of note, while monthly donors have a younger skew, it appeals to all ages, with more Boomers and Seniors saying it's their #1 preferred method of giving.
Top 2 Preferred Channels of Giving by Age

Base: U.S. charitable donors, n=1,196. “In Person” top responses: at the org, at store checkout, collection box/Red Kettle.
Base: U.S. charitable donors, n=1,196. “In Person” top responses: at the org, at store checkout, collection box/Red Kettle.
Preferred Channel of Giving by Average Age
An integrated, multichannel approach is still key to not only meet donors where they are, but also to leverage more influential channels, balanced with lower-cost digital channels.


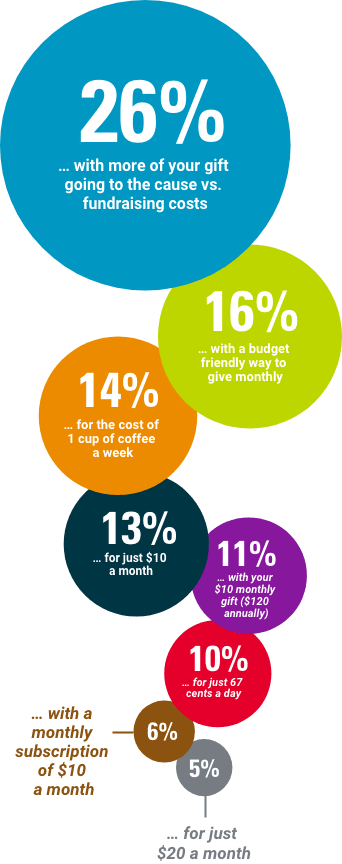
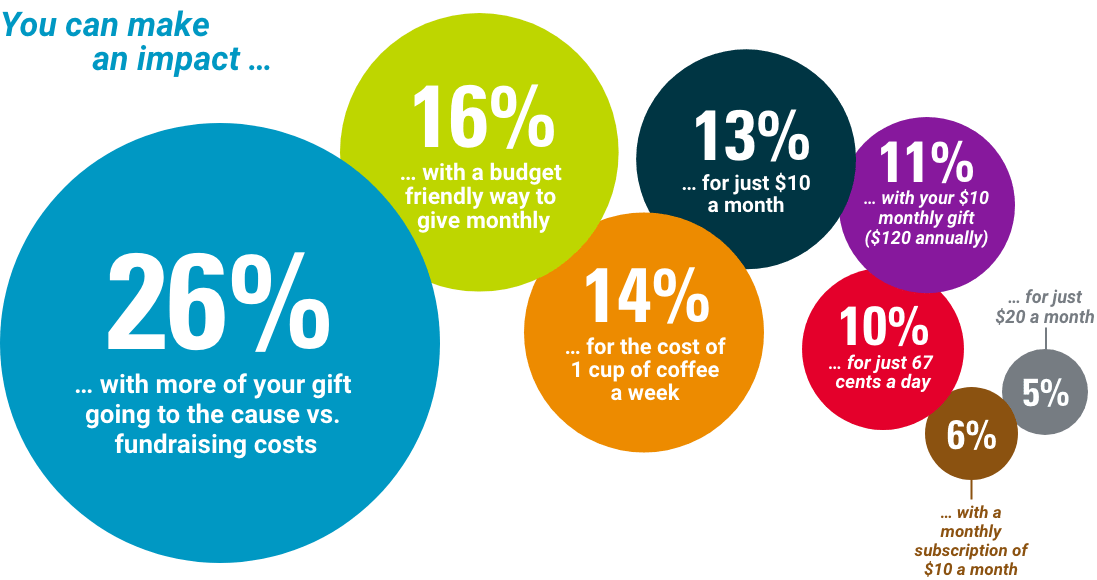
Monthly Giving Offering Testing
We continually test monthly giving offers in research and in communications to investigate the best performers overall and by segment. The efficiency offer continues to be a champion in both the U.S. as well as Canada, and plays more to an older audience.
You can make an impact...

The top monthly offer for Millennials and Gen Z is: "... for just the cost of a cup of coffee a week" (18%, 19% respectively)

The top monthly offer for Gen X, Boomers, and Seniors is the efficiency play: "With more of your gift going to the cause vs. fundraising costs" as shown below.
Top Efficiency Offer by Generation

Base: U.S. charitable donors, n=1,196.
Getting the right cadence of communication to monthly supporters is tricky. Without any stewardship, organizations can lose out on extra gift revenue — which is 45% of sustainer donor value for human services and animal welfare organizations! Too many communications can be off-putting to these key supporters. The majority of sustaining donors prefer a lower cadence of communication: monthly or quarterly.

Monthly Donor Communication Preference
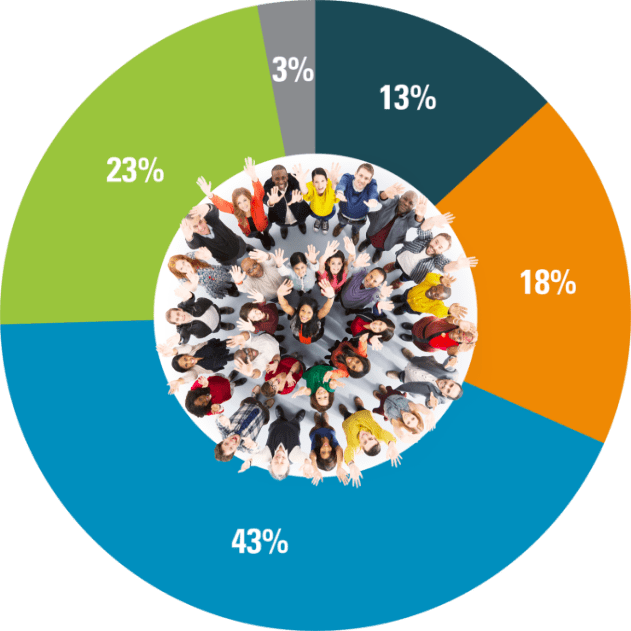
Monthly Donor Communication Preference
Let your data guide your strategy